
Rainfall deficit districts of the country
- Archives
-
-
2013
- Rainfall deficit districts of the country upto 11-09-2013


Central Research Institute for Dryland Agriculture
Hyderabad - 500 059September 13, 2013
Weekly update on Rainfall Deficit Districts in the country
The number of districts with more than 50% deficit as on 12th September, 2013 are given in the Table - 1. The number has raised up to 30 from 25 in the previous week (4th September, 2013). The list of districts as on 12th September is given in Table-1 and a spatial map comparing the weekly change in the rainfall is given in the figure.
Table 1
Selected districts showing more than 50% rainfall deficit based on cumulative rainfall between 01.June to 11. September 2013
STATE/DISTRICT (NAME)
ACTUAL (mm)
NORMAL (mm)
% DEP.
Contingency plans submitted
Arunachal Pradesh (3/16)
Lower Subansiri
1. 166.8
876.1
-81
Not available with CRIDA
Tawang
2. 913.6
2162.7
-58
Not available
West Kameng
3. 1067.5
2162.7
-51
Not available
Assam (1/27)
Baksa
4. 974.5
2123.6
-54
Not available
Meghalaya (3/7)
West Khasi Hills
5. 307.0
2504.6
-88
Under draft
South Garo Hills
6. 373.0
1474.1
-75
Under draft
Jaintia Hills
7. 1350.0
4198.3
-68
Not available
Nagaland (3/11)
Zunheboto
8. 331.0
1227.1
-73
Under draft
Mokokchung
9. 441.0
1564.1
-72
Under draft
Kephire
10. 443.8
1227.1
-64
Under draft
Manipur (1/9)
Ukhrul
11. 222.0
950.8
-77
Under draft
Mizoram (2/9)
Serchhip
12. 561.0
1437.7
-61
Under draft
Mamit
13. 621.0
1558.3
-60
Not available
Bihar (7/38)
Vaishali
14. 333.0
887.1
-62
Lakhisarai
15. 334.0
830.4
-60
Under draft
Sitamarhi
16. 402.2
977.0
-59
Yes
Sheikhpura
17. 345.7
752.5
-54
Under draft
Sheohar
18. 451.9
977.0
-54
Under draft
Gaya
19. 366.2
780.7
-53
Under draft
Nawada
20. 379.4
794.2
-52
Under draft
Chhattisgarh (2/18)
Jashpur
21. 585.2
1218.1
-52
Yes
Surguja
22. 540.0
1093.7
-51
Yes
Uttar Pradesh (2/71)
Kushi Nagar
23. 355.8
1001.3
-64
Yes
Gautam Buddha Nagar
24. 234.0
492.8
-53
Under Draft
Haryana (3/21)
Kurukshetra
25. 199.8
511.7
-61
Yes
Rohtak
26. 189.2
480.7
-61
Yes
Panipat
27. 212.5
480.1
-56
Yes
Himachal Pradesh (1/12)
Lahaul & Spiti
28. 106.8
397.8
-73
Yes
Tamil Nadu & Pondicherry (2/32)
Toothukudi
29. 11.2
48.4
-77
Yes
Tirupur
30. 23.1
94.5
-76
Yes
- Rainfall deficit districts of the country upto 04-09-2013

Central Research Institute for Dryland Agriculture
Hyderabad - 500 059September 06, 2013
Weekly update on Rainfall Deficit Districts in the country
The number of districts with more than 50% deficit as on 4th September, 2013 are given in the Table - 1. The number has come down to 25 from 34 in the previous week (28th August, 2013). The list of districts as on 4th September is given in Table-1 and a spatial map comparing the weekly change in the rainfall is given in the figure.
Table 1
Selected districts showing more than 50% rainfall deficit based on cumulative rainfall between 01.June to 04. September 2013
STATE/DISTRICT (NAME)
ACTUAL (mm)
NORMAL (mm)
% DEP.
Contingency plans submitted
Arunachal Pradesh (3/16)
Lower Subansiri
1. 166.6
827.7
-80
Not available with CRIDA
Tawang
2. 896.7
2049.9
-56
Not available
West Kameng
3. 957.0
2049.9
-53
Not available
Assam (1/27)
Baksa
4. 781.9
2027.0
-61
Not available
Meghalaya (3/7)
West Khasi Hills
5. 302.0
2392.9
-87
Under draft
South Garo Hills
6. 219.0
1389.2
-84
Under draft
Jaintia Hills
7. 1317.0
3968.7
-67
Not available
Nagaland (3/11)
Mokokchung
8. 337.0
1489.2
-77
Under draft
Zunheboto
9. 331.0
1172.5
-72
Under draft
Kephire
10. 411.8
1172.5
-65
Under draft
Manipur (1/9)
Ukhrul
11. 222.0
910.5
-76
Under draft
Mizoram (2/9)
Mamit
12. 443.0
1456.4
-70
Under draft
Serchhip
13. 546.0
1357.8
-60
Not available
Bihar (5/38)
Sitamarhi
14. 366.3
929.6
-61
Yes
Vaishali
15. 324.6
820.5
-60
Under draft
Lakhisarai
16. 334.0
773.0
-57
Under draft
Sheohar
17. 437.1
929.6
-53
Under draft
Sheikhpura
18. 345.7
700.1
-51
Under draft
Uttar Pradesh (1/71)
Kushi Nagar
19. 347.3
946.2
-63
Yes
Haryana (3/21)
Kurukshetra
20. 199.1
486.3
-59
Yes
Rohtak
21. 189.2
454.3
-58
Yes
Panipat
22. 212.1
449.3
-53
Yes
Himachal Pradesh (1/12)
Lahaul & Spiti
23. 106.8
375.2
-72
Yes
Tamil Nadu & Pondicherry (2/32)
Toothukudi
24. 7.4
42.0
-82
Yes
Tirupur
25. 23.1
86.4
-73
Yes
- Rainfall deficit districts of the country upto 28-08-2013


Central Research Institute for Dryland Agriculture
Hyderabad - 500 059August 31, 2013
Weekly update on Rainfall Deficit Districts in the country
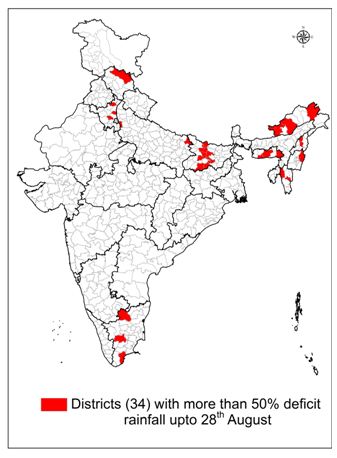
The number of districts with more than 50% deficit as on 28th August, 2013 are given in the Table - 1. The number has come down to 34 from 35 in the previous week (21st August, 2013). The list of districts as on 28th August is given in Table-1 and a spatial map comparing the weekly change in the rainfall is given in the figure.
Selected districts showing more than 50% rainfall deficit based on cumulative rainfall between 01.June to 28. August 2013
Table 1
STATE/DISTRICT (NAME)
ACTUAL (mm)
NORMAL (mm)
% DEP.
Contingency plans submitted
Arunachal Pradesh (4/16)
Lower Subansiri
1. 158.6
785.4
-80
Not available with CRIDA
Dibang Valley
2. 311.0
791.0
-61
Not available
West Kameng
3. 826.6
1949.0
-58
Not available
Tawang
4. 844.7
1949.0
-57
Under draft
Assam (1/27)
Baksa
5. 738.1
1934.3
-62
Not available
Meghalaya (3/7)
South Garo Hills
6. 79.0
1320.4
-94
Under draft
West Khasi Hills
7. 297.0
2263.1
-87
Under draft
Jaintia Hills
8. 1146.0
3787.2
-70
Not available
Nagaland (3/11)
Mokokchung
9. 314.0
1407.1
-78
Under draft
Zunheboto
10. 337.0
1115.0
-70
Under draft
Kephire
11. 355.8
1115.0
-68
Under draft
Manipur (1/9)
Ukhrul
12. 222.0
865.9
-74
Under draft
Mizoram (2/9)
Mamit
13. 438.0
1361.9
-68
Under draft
Serchhip
14. 532.0
1276.2
-58
Not available
Bihar (10/38)
Sitamarhi
15. 302.5
885.8
-66
Yes
Vaishali
16. 272.3
780.5
-65
Under draft
Lakhisarai
17. 257.0
721.9
-64
Under draft
Sheohar
18. 349.5
885.8
-61
Under draft
Gaya
19. 275.2
679.3
-59
Under draft
Nawada
20. 282.1
696.1
-59
Yes
Samastipur
21. 313.6
763.1
-59
Under draft
Muzaffarpur
22. 355.0
757.1
-53
Under draft
Sheikhpura
23. 306.9
657.4
-53
Under draft
Patna
24. 340.7
706.8
-52
Under draft
Uttar Pradesh (2/71)
Kushi Nagar
25. 316.3
896.0
-65
Yes
Gautam Buddha Nagar
26. 207.0
441.4
-53
Yes
Haryana (3/21)
Kurukshetra
27. 195.5
462.2
-58
Yes
Rohtak
28. 188.8
423.4
-55
Yes
Panipat
29. 210.0
429.7
-51
Yes
Himachal Pradesh (1/12)
Lahaul & Spiti
30. 106.1
346.8
-69
Yes
Tamil Nadu & Pondicherry (4/32)
Tirupur
31. 2.7
77.6
-97
Yes
Toothukudi
32. 5.4
36.7
-85
Yes
Dharmapuri
33. 66.5
220.4
-70
Yes
Dindigul
34. 60.2
160.3
-62
Yes
- Rainfall deficit districts of the country upto 21-08-2013


Central Research Institute for Dryland Agriculture
Hyderabad - 500 059August 23, 2013
Weekly update on Rainfall Deficit Districts in the country
The number of districts with more than 50% deficit as on 21st August, 2013 are given in the Table - 1. The number has come down to 35 from 48 in the previous week (14th August, 2013). The list of districts as on 21st August is given in Table-1 and a spatial map comparing the weekly change in the rainfall is given in the figure. Crop sowings in Jharkhand has improved considerably. However, paddy transplanting in nearly 10 districts in Bihar is affected, particularly in lowlands. It is already delayed considerably. In north east, deficit conditions have impacted paddy and other upland crops in Meghalaya, Nagaland and Arunachal Pradesh. Situation has however improved in Assam.
Selected districts showing more than 50% rainfall deficit based on cumulative rainfall between 01.June to 21. August 2013
Table 1
STATE/DISTRICT (NAME)
ACTUAL (mm)
NORMAL (mm)
% DEP.
Contingency plans submitted
Arunachal Pradesh (4/16)
Lower Subansiri
1. 133.4
737.6
-82%
Not available with CRIDA
West Kameng
2. 696.1
1833.1
-62%
Not available
Dibang Valley
3. 297.0
746.5
-60%
Not available
Tawang
4. 766.7
1833.1
-58%
Under draft
Assam (1/27)
Baksa
5. 687.7
1783.9
-61%
Not available
Meghalaya (3/7)
South Garo Hills
6. 71.0
1230.1
-94%
Under draft
West Khasi Hills
7. 217.0
2101.9
-90%
Under draft
Jaintia Hills
8. 1095.0
3525.7
-69%
Not available
Nagaland (3/11)
Mokokchung
9. 308.0
1318.7
-77%
Under draft
Zunheboto
10. 331.0
1043.6
-68%
Under draft
Kephire
11. 350.9
1043.6
-66%
Under draft
Manipur (1/9)
Ukhrul
12. 222.0
822.2
-73%
Under draft
Mizoram (2/9)
Mamit
13. 427.0
1250.1
-66%
Under draft
Serchhip
14. 463.0
1178.9
-61%
Not available
Bihar (10/38)
Lakhisarai
15. 218.0
655.0
-67%
Yes
Vaishali
16. 233.4
707.2
-67%
Under draft
Nawada
17. 218.1
636.1
-66%
Under draft
Sitamarhi
18. 266.5
792.2
-66%
Under draft
Gaya
19. 224.4
619.2
-64%
Under draft
Samastipur
20. 306.8
703.1
-56%
Yes
Sheohar
21. 349.5
792.2
-56%
Under draft
Muzaffarpur
22. 321.8
678.0
-53%
Under draft
Sheikhpura
23. 287.4
593.8
-52%
Under draft
Patna
24. 310.4
634.4
-51%
Under draft
Uttar Pradesh (2/71)
Kushi Nagar
25. 288.8
806.9
-64%
Yes
Gautam Buddha Nagar
26. 174.0
391.3
-56%
Yes
Haryana (3/21)
Kurukshetra
27. 185.5
414.5
-55%
Yes
Rohtak
28. 178.6
375.8
-52%
Yes
Panipat
29. 186.5
381.4
-51%
Yes
Himachal Pradesh (1/12)
Lahaul & Spiti
30. 105.6
315.9
-67%
Yes
Tamil Nadu & Pondicherry (5/32)
Tirupur
31. 2.7
68.0
-96%
Yes
Toothukudi
32. 3.4
31.4
-89%
Yes
Dharmapuri
33. 66.7
189.0
-65%
Yes
Dindigul
34. 59.0
138.9
-58%
Yes
Madurai
35. 81.2
166.5
-51%
Yes
- Rainfall deficit districts of the country upto 14-08-2013


Central Research Institute for Dryland Agriculture
Hyderabad - 500 059August 16, 2013
Weekly update on Rainfall Deficit Districts in the country
The number of districts with more than 50% deficit as on 14th August, 2013 are given in the Table - 1. The number has come down to 48 from 53 in the previous week (7th August, 2013). The list of districts as on 14th August is given in Table-1 and a spatial map comparing the weekly change in the rainfall is given in the figure.
Selected districts showing more than 50% rainfall deficit based on cumulative rainfall between 01.June to 14. August 2013
STATE/DISTRICT (NAME)
ACTUAL (mm)
NORMAL (mm)
% DEP.
Contingency plans submitted
Arunachal Pradesh (4/16)
Lower Subansiri
1. 133.4
653.8
-80
Under draft
Dibang Valley
2. 278.0
707.7
-61
Under draft
Tawang
3. 725.7
1692.7
-57
Under draft
West Kameng
4. 769.3
1692.7
-55
Under draft
Assam (1/27)
Baksa
5. 669.7
1662.8
-60
No
Meghalaya (3/7)
South Garo Hills
6. 66.0
1139.1
-94
Under draft
West Khasi Hills
7. 203.0
1995.1
-90
Under draft
Jaintia Hills
8. 1029.0
3364.0
-69
Under draft
Nagaland (3/11)
Mokokchung
9. 301.0
1258.5
-76
Under draft
Kephire
10. 325.9
946.6
-66
Under draft
Zunheboto
11. 331.0
946.6
-65
Under draft
Manipur (1/9)
Ukhrul
12. 222.0
765.4
-71
Under draft
Mizoram (2/9)
Mamit
13. 419.0
1129.7
-63
Under draft
Serchhip
14. 412.0
1067.7
-61
Under draft
Tripura (1/4)
Dhalai
15. 483.2
1010.5
-52
Under draft
Jharkhand (3/24)
Koderma
16. 237.7
573.1
-59
Yes
Chatra
17. 305.2
649.2
-53
Yes
Seraikela-Kharsawan
18. 354.6
725.7
-51
Yes
Bihar (11/38)
Nawada
19. 155.3
572.6
-73
Yes
Sitamarhi
20. 209.8
733.2
-71
Under draft
Gaya
21. 190.7
557.2
-66
Under draft
Lakhisarai
22. 205.0
597.8
-66
Under draft
Vaishali
23. 223.0
644.8
-65
Under draft
Patna
24. 218.1
579.8
-62
Under draft
Sheohar
25. 319.5
733.2
-56
Under draft
Sheikhpura
26. 251.1
541.3
-54
Under draft
Samastipur
27. 295.0
630.6
-53
Yes
Muzaffarpur
28. 294.7
616.2
-52
Under draft
Jahanabad
29. 243.9
494.2
-51
Under draft
Uttar Pradesh (2/71)
Kushi Nagar
30. 264.8
719.8
-63
Yes
Gautam Buddha Nagar
31. 130.0
338.8
-62
Yes
Haryana (4/21)
Rohtak
32. 106.2
337.3
-69
Yes
Panipat
33. 121.7
327.4
-63
Yes
Kurukshetra
34. 151.8
356.4
-57
Yes
Jhajjar
35. 120.6
268.0
-55
Yes
Delhi (2/9)
West Delhi
36. 160.0
412.2
-61
-
North East Delhi
37. 194.0
412.2
-53
-
Himachal Pradesh (1/12)
Lahaul & Spiti
38. 80.7
286.6
-72
Yes
Jammu & Kashmir (2/22)
Kargil
39. 2.0
21.1
-91
Yes
Udhampur
40. 447.8
920.7
-51
No
Tamil Nadu & Pondicherry (8/32)
Tirupur
41. 0.7
60.3
-99
Yes
Toothukudi
42. 2.4
27.8
-91
Yes
Dharmapuri
43. 51.5
166.3
-69
Yes
Dindigul
44. 46.6
122.9
-62
Yes
Trichy
45. 46.2
108.3
-57
Yes
Ariyalur
46. 74.6
169.3
-56
Yes
Madurai
47. 65.7
146.7
-55
Yes
Karur
48. 34.8
70.4
-51
Yes
- Rainfall deficit districts of the country upto 07-08-2013


Central Research Institute for Dryland Agriculture
Hyderabad - 500 059August 13, 2013
Special Bulletin on Rainfall Deficit Districts in the country
The number of districts with more than 50% deficit as on 7th August July, 2013 are given in the Table - 1. The number has come down to 53 from 60 in the previous week (31st July, 2013). The list of districts as on 31st July is given in Table-1 and a spatial map comparing the weekly change in the rainfall is given in the figure.
Table 1
Selected districts showing more than 50% rainfall deficit based on cumulative rainfall between 01.June to 07. August 2013
STATE/DISTRICT (NAME) ACTUAL
NORMAL
% DEP.
Contingency plan
Arunachal Pradesh (4/16)
Lower Subansiri
1. 96.8
613.9
-84
Under draft
Dibang Valley
2. 261.0
677.5
-61
Under draft
West Kameng
3. 623.7
1536.3
-59
Under draft
Tawang
4. 664.7
1536.3
-57
Under draft
Assam (3/27)
Baksa
5. 615.1
1539.8
-60
No
Dhubri
6. 594.2
1251.0
-53
Yes
Nalbari
7. 539.0
1106.5
-51
Yes
Meghalaya (4/7)
East Garo Hills
8. 15.0
1097.1
-99
Under draft
South Garo Hills
9. 66.0
1064.4
-94
Under draft
West Khasi Hills
10 203.0
1856.0
-89
Under draft
Jaintia Hills
11. 1010.0
3132.3
-68
Under draft
Nagaland (3/11)
Mokokchung
12. 276.0
1166.1
-76
Under draft
Kephire
13. 324.9
870.2
-63
Under draft
Zunheboto
14. 331.0
870.2
-62
Under draft
Manipur (1/9)
Ukhrul
15. 222.0
701.3
-68
Under draft
Mizoram (3/9)
Kolasib
16. 43.0
975.3
-96
Under draft
Serchhip
17. 357.0
959.5
-63
Under draft
Mamit
18. 414.0
1024.2
-60
Under draft
Gangetic West Bengal (1/13)
Murshidabad
19. 308.6
634.1
-51
Under draft
Jharkhand (4/24)
Chatra
20. 174.7
565.2
-69
Yes
Koderma
21. 213.3
512.4
-58
Yes
Hazaribag
22. 249.4
573.2
-56
Yes
Dumka
23. 281.8
610.4
-54
Yes
Bihar (11/38)
Nawada
24. 95.4
508.1
-81
Yes
Sitamarhi
25. 179.2
656.4
-73
Under draft
Gaya
26. 139.2
496.4
-72
Under draft
Vaishali
27. 189.4
575.4
-67
Under draft
Lakhisarai
28. 185.0
544.0
-66
Under draft
Patna
29. 204.4
513.2
-60
Under draft
Sheohar
30. 261.5
656.4
-60
Under draft
Nalanda
31. 196.1
473.3
-59
Under draft
Jahanabad
32. 184.5
435.3
-58
Under draft
Muzaffarpur
33. 254.2
551.0
-54
Under draft
Sheikhpura
34. 230.3
495.3
-54
Under draft
Uttar Pradesh (2/71)
Gautam Buddha Nagar
35. 97.0
279.6
-65
Yes
Kushi Nagar
36. 236.8
629.2
-62
Yes
Haryana (3/21)
Kurukshetra
37. 94.2
312.4
-70
Yes
Panipat
38. 89.6
279.3
-68
Yes
Rohtak
39. 95.4
290.6
-67
Yes
Delhi (1/4)
West Delhi
40. 153.0
351.2
-56
-
Himachal Pradesh (1/12)
Lahaul & Spiti
41. 78.0
250.9
-69
Yes
Chhattisgarh (1/18)
Surguja
42. 317.1
691.9
-5
Yes
Tamil Nadu & Pondicherry (11/32)
Tirupur
43. 0.7
55.1
-99
Yes
Toothukudi
44. 1.3
25.1
-95
Yes
Trichy
45. 11.7
95.8
-88
Yes
Karur
46. 8.4
61.3
-86
Yes
Ariyalur
47. 21.2
144.1
-85
Yes
Dharmapuri
48. 42.1
148.3
-72
Yes
Perambalur
49. 26.3
89.2
-71
Yes
Madurai
50. 38.9
129.7
-70
Yes
Dindigul
51. 36.9
110.8
-67
Yes
Pudukkottai
52. 62.2
139.4
-55
Yes
Virudhunagar
53. 30.2
66.1
-54
Yes
- Rainfall deficit districts of the country upto 31-07-2013


- Rainfall deficit districts of the country upto 24-07-2013

- Rainfall deficit districts of the country upto 17-07-2013

- Rainfall deficit districts of the country upto 10-07-2013


- Rainfall deficit districts of the country upto 03-07-2013


- Rainfall deficit districts of the country upto 26-06-2013


- Rainfall deficit districts of the country upto 11-09-2013
-
2012
- Agro-Advisories for Assam state for the period 20th to 26th October 2012
- Selected districts showing more than 50% rainfall deficit based on cumulative rainfall between 01.June to 26.September 2012
- Selected districts showing more than 50% rainfall deficit based on cumulative rainfall between 01.June to 19.September 2012
- Selected districts showing more than 50% rainfall deficit based on cumulative rainfall between 01.June to 12.September 2012
- Selected districts showing more than 50% rainfall deficit based on cumulative rainfall between 01.June to 05.September 2012
- Selected districts showing more than 50% rainfall deficit based on cumulative rainfall between 01.June to 29.August 2012
- Selected districts showing more than 50% rainfall deficit based on cumulative rainfall between 01.June to 22.August 2012
- Selected districts showing more than 50% rainfall deficit based on cumulative rainfall between 01.June to 15.August 2012
- Selected districts showing more than 50% rainfall deficit based on cumulative rainfall between 01.June to 01.August 2012
- Selected districts showing more than 50% rainfall deficit based on cumulative rainfall between 01.June to 08.August 2012
-
2013